October 4th, 2013 by reynman
We were contacted by N8 recently concerning a discussion on blowouts that he was having with derbynerd over on DNN. While I’m not sure I exactly answered his question (sorry N8), it started me on an investigation that I found interesting and I thought I’d share some observations.
The question I started to ask was “how big of a lead has ever been erased, regardless of who eventually won?”. And, “how often does that sort of thing happen?”. So I went back into our stats database to have a look. As of this writing we now have over 1500 statsbooks uploaded, most of which (over 1000) are from this season or last season. There are some notable exceptions like the VRDL vs. Wasatch bout from the Big O earlier this year – I seem to recall close to a 100 point Wasatch lead in the first half that VRDL eventually erased (someone send us that statsbook...please). So I will not claim that this analysis is fully inclusive, but it is still interesting nonetheless.
In the following plot, I show the distribution of every lead (that we know of) that has ever been erased as a function of the maximum score-difference that was achieved before it was erased.
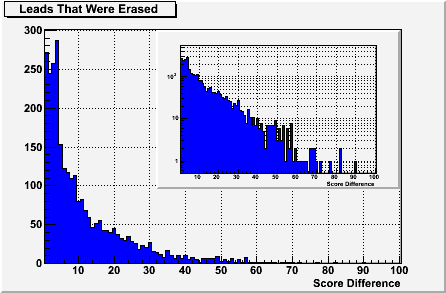
For those not used to looking at a plot like this, the x-axis is showing the score difference (at it’s maximum) for the lead, before it was erased. The y-axis is showing the number of times over all the bouts that we have, that a lead of that score difference has been erased. The smaller inset plot in the upper right is exactly the same, I have just changed the y-axis to use a logarithmic scale, allowing easier observation of the single events out at the extreme right. This plot represents almost 2800 total leads that have been erased. The largest recorded lead to be erased is 90 points from the 5/18/13 bout between Ohio and Atlanta. There are 2 more at 82 and then everything else is below 80.
Now derbynerd had an interesting suggestion that a “blowout” should be defined as a point difference at which “the losing team have a < 1% [chance] of winning” – guessing it was somewhere around 60 points. By integrating the above plot, I find that 99% of the erased leads are at 56 points or below – a commendation to derbynerd's instincts.
Another way to look at the probability, however, is to ask how many jams it takes to erase the lead. In the following scatter plot, I’m now showing the same 2800 leads, but now the y-axis is the number of jams between when that maximum score-difference happened and when the lead was “erased” – either the game was tied or the other team was leading.
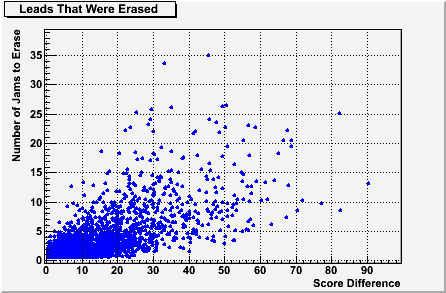
I find this plot fascinating. I wonder about those games that took 34 or 35 jams (almost an entire game) to recover from a 30-40 point lead. But more than that, I notice that the vast majority of these leads were erased within 10 jams (even leads as large as 70 or 80 points). In fact, almost 85% of these were erased within only 5 jams.
So that started me thinking about bouts that are uncertain right up to the end. Instead of “blowouts”, the ubiquitous “anybody’s game” comment comes to mind. I think a lead that can be erased in the last 5 jams would be a pretty good representation of that uncertainty. So what does that really look like? Well, the following plot is identical to the first one, but now it’s only showing leads that were erased in 5 jams or less.
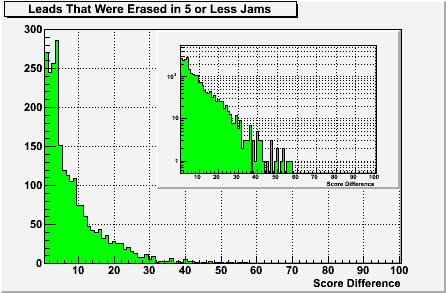
As you can see, it’s pretty rare to erase a lead above 40 points in less than 5 jams -- the highest recorded so far is 57 points from this bout. To use derbynerd’s criteria, the 99% inclusion limit would be at 29 points, but I might be more inclined to think about the 90% limit which is at 19 points. So that means that with 5 jams left in the game, there’s only a 10% chance that a 20 point lead could be erased and only a 1% chance that a 30 point lead could be erased. That’s actually much harder than my instincts would have predicted.
So what’s it all mean? I have no idea. And I don’t think I can provide a better definition than anyone else of what constitutes a blowout. But I found it interesting to look at these numbers and I thought you might too.

Comments
Interesting. The first thing that came to mind regarding this analysis is perhaps comparing it to how many jams it takes for a team to build up such a lead in the first place. You can't have a comeback without that happening first, obviously. Would the number of jams for the pullaways and the comebacks be noticeably different, if all we're really talking about is a lopsided points differential in any given number of jams?
yeah, good point. For any jam that got erased, I took a look at how long it took to create that lead. Here's the difference (number of jams to create the lead, minus the number of jams to erase the lead) plotted against the size of the lead.
I have to admit, I was very surprised to see how even it is. Of course there are outliers, but I guess I was expecting most leads to get erased more quickly than they were created. Apparently that's just not the case. In fact, a full 40% of these leads took exactly the same number of jams to create and erase.
As I suspected. I'm not surprised there's an assumption that leads are erased more quickly than they are created. It seems to me as if everyone in derby focuses more on the comeback than on the pullaway, even though both are instances of big scoring imbalances one way or the other.
Personally, I see a big pullaway followed by a big comeback as one mini-blowout followed by another mini-blowout. Just because such a game might ultimately wind up close in the end doesn't change the fact that a team is getting spanked for most of the game, even if that applies to both teams for half of a game. You know?
Wasatch vs Victoria - looks like the biggest lead was 86, at:
http://youtu.be/6b-JoBfiiBw?t=27m38s
This doesn't answer the question I was asking, but I think these results are more interesting than what I was asking to begin with. Nice job!
And if you were curious, I was interested in a definition of games that weren't blowouts. I defined them as any game that was tied or had a lead chance at any time int he second half. Thus, for more than 50% of the game it was literally anybody's game. The question I was interested in was, what was the biggest "blowout" (final score difference) of a game that had a tie or lead chance within the second period? So, kind of the inverse of the question you ended up asking.
Right. I realized as I was putting the post together that I had totally missed your original point. As I said in the response to SkateMail, if I adopt your definition of a "close game" the largest final score difference was 144 points. However, perhaps a better way to look at this is to plot the final score difference as a function of the number of jams between when that last lead change (or tie) happened and the end of the bout.
To me it kind of looks all over the place. I tried a few statistical tests to see if there is any kind of underlying structure, but all I could come up with is just that the final score difference represents a simple broadening (like counting statistics) as a function of the number of jams that have been allowed to pass. So any limit you would choose based on this definition would be more reflective of how many jams you have in a period.
The Men's Euros final from 2012 was remarkable - at one point, Toulouse had a 99-point lead, and they still led by 65 with seven minutes remaining. I think there were five more jams in the bout, and Southern Discomfort eventually beat them by two points. It'd be great to have the stats, but there's a useful summary from Rollin News.
And in reply to N8's query, my starting bid is Boston vs Philly at last year's Easterns - several lead changes in the second half, but ultimately a 123 point win for Philly.
Close. That's actually #4 on the list. According to the records we have, the largest final score difference that satisfies N8's criteria is the 9/20/13 Houston(102) @ Rocky(246) bout in which Houston was leading by 3 after the first jam in the second half.
I'm compiling a more complete set of these numbers now and hopefully I'll have them up soon.